Rust Debugger Intro
A high-level overview of the debuggers that work with the Rust programming language is given in the article Debugging support in the Rust compiler.
The main points from it, related to the subject of this post, are as follows:
- A debugger is a computer program that permits a programmer to track the execution of a target program.
- Widely used debuggers are compatible with Rust.
- Users of Linux, *nix, and macOS with Intel may prefer GDB.
- Users of macOS with Apple Silicon should use LLDB.
- WinDbg & CDB are for Windows users.
- Wrapper scripts rust-gdb, rust-lldb, rust-windbg are shipped with Rust. They enable pretty printers on debugger output.
In the section below, we review the basics of applying a debugging tool. The
following examples show how to interact with LLDB. Note that the commands can
be used interchangeably for lldb / rust-lldb and gdb / rust-gdb (LLDB
was developed with GDB-compatibility in mind). WinDbg commands would differ.
LLDB Usage Basics
To confirm that LLDB is available, execute the following command in a shell of your choice. The output should be close to the one shown below.
lldb --version
lldb-1403.0.17.67
Apple Swift version 5.8.1 (swiftlang-5.8.0.124.5 clang-1403.0.22.11.100)
Now, build your Rust project
cargo build
and then start LLDB session
lldb target/debug/<project-name>
The CLI output will be close to
(lldb) target create "target/debug/<project-name>"
Current executable set to 'target/debug/<project-name>' (arm64).
(lldb) |
The most important command for our first use is help, which outputs the list of available LLDB commands.
The second most useful command for us to start debugging is break, which adds breakpoints (places to stop) to our code. To see more information on it, enter help break.
Carefully reading the output of help commands
allows us to find all the needed instructions and grasp the logic of interaction
with LLDB. For instance, the following longer and shorter versions of a
command both add a breakpoint at the 10th line of the file main.rs.
(lldb) break set --file main.rs --line 10
(lldb) b main.rs:10
Another pair of examples sets a breakpoint by a function name:
(lldb) break set --name some_fun
(lldb) b some_fun
After configuring breakpoints, launch the debugging process with r (run).
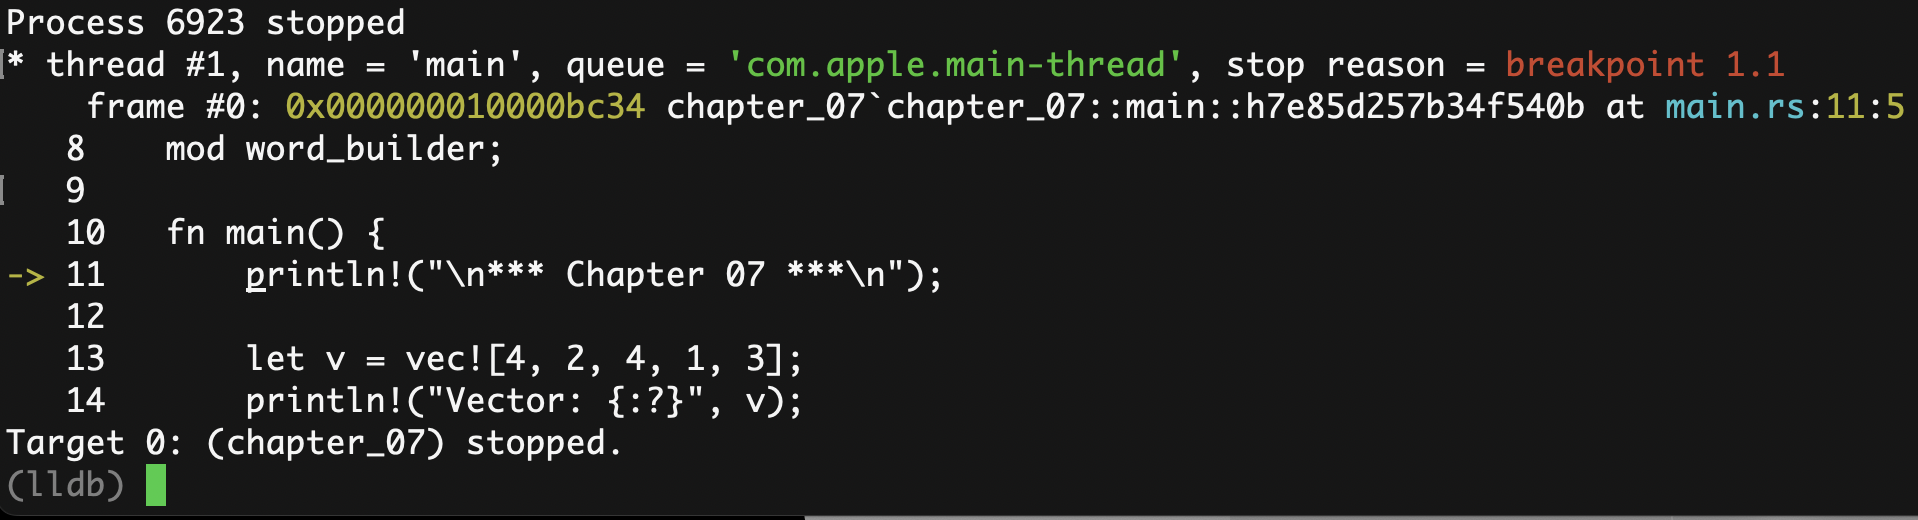
And then proceed controlling the process with the commands:
- n
- next for step-over (go to the next seen line, over any other details).
- s
- step for step-in (go to the next executed line, into the details).
- f
- finish for step-out (get out of the step-in).
- c
- continue execution (until the next breakpoint).
Combining this with the commands p (print: evaluates an expression on the current thread) and v (frame variable, fr v: shows variable(s) of the current frame) provides a decent foundational set of operations for debugging.
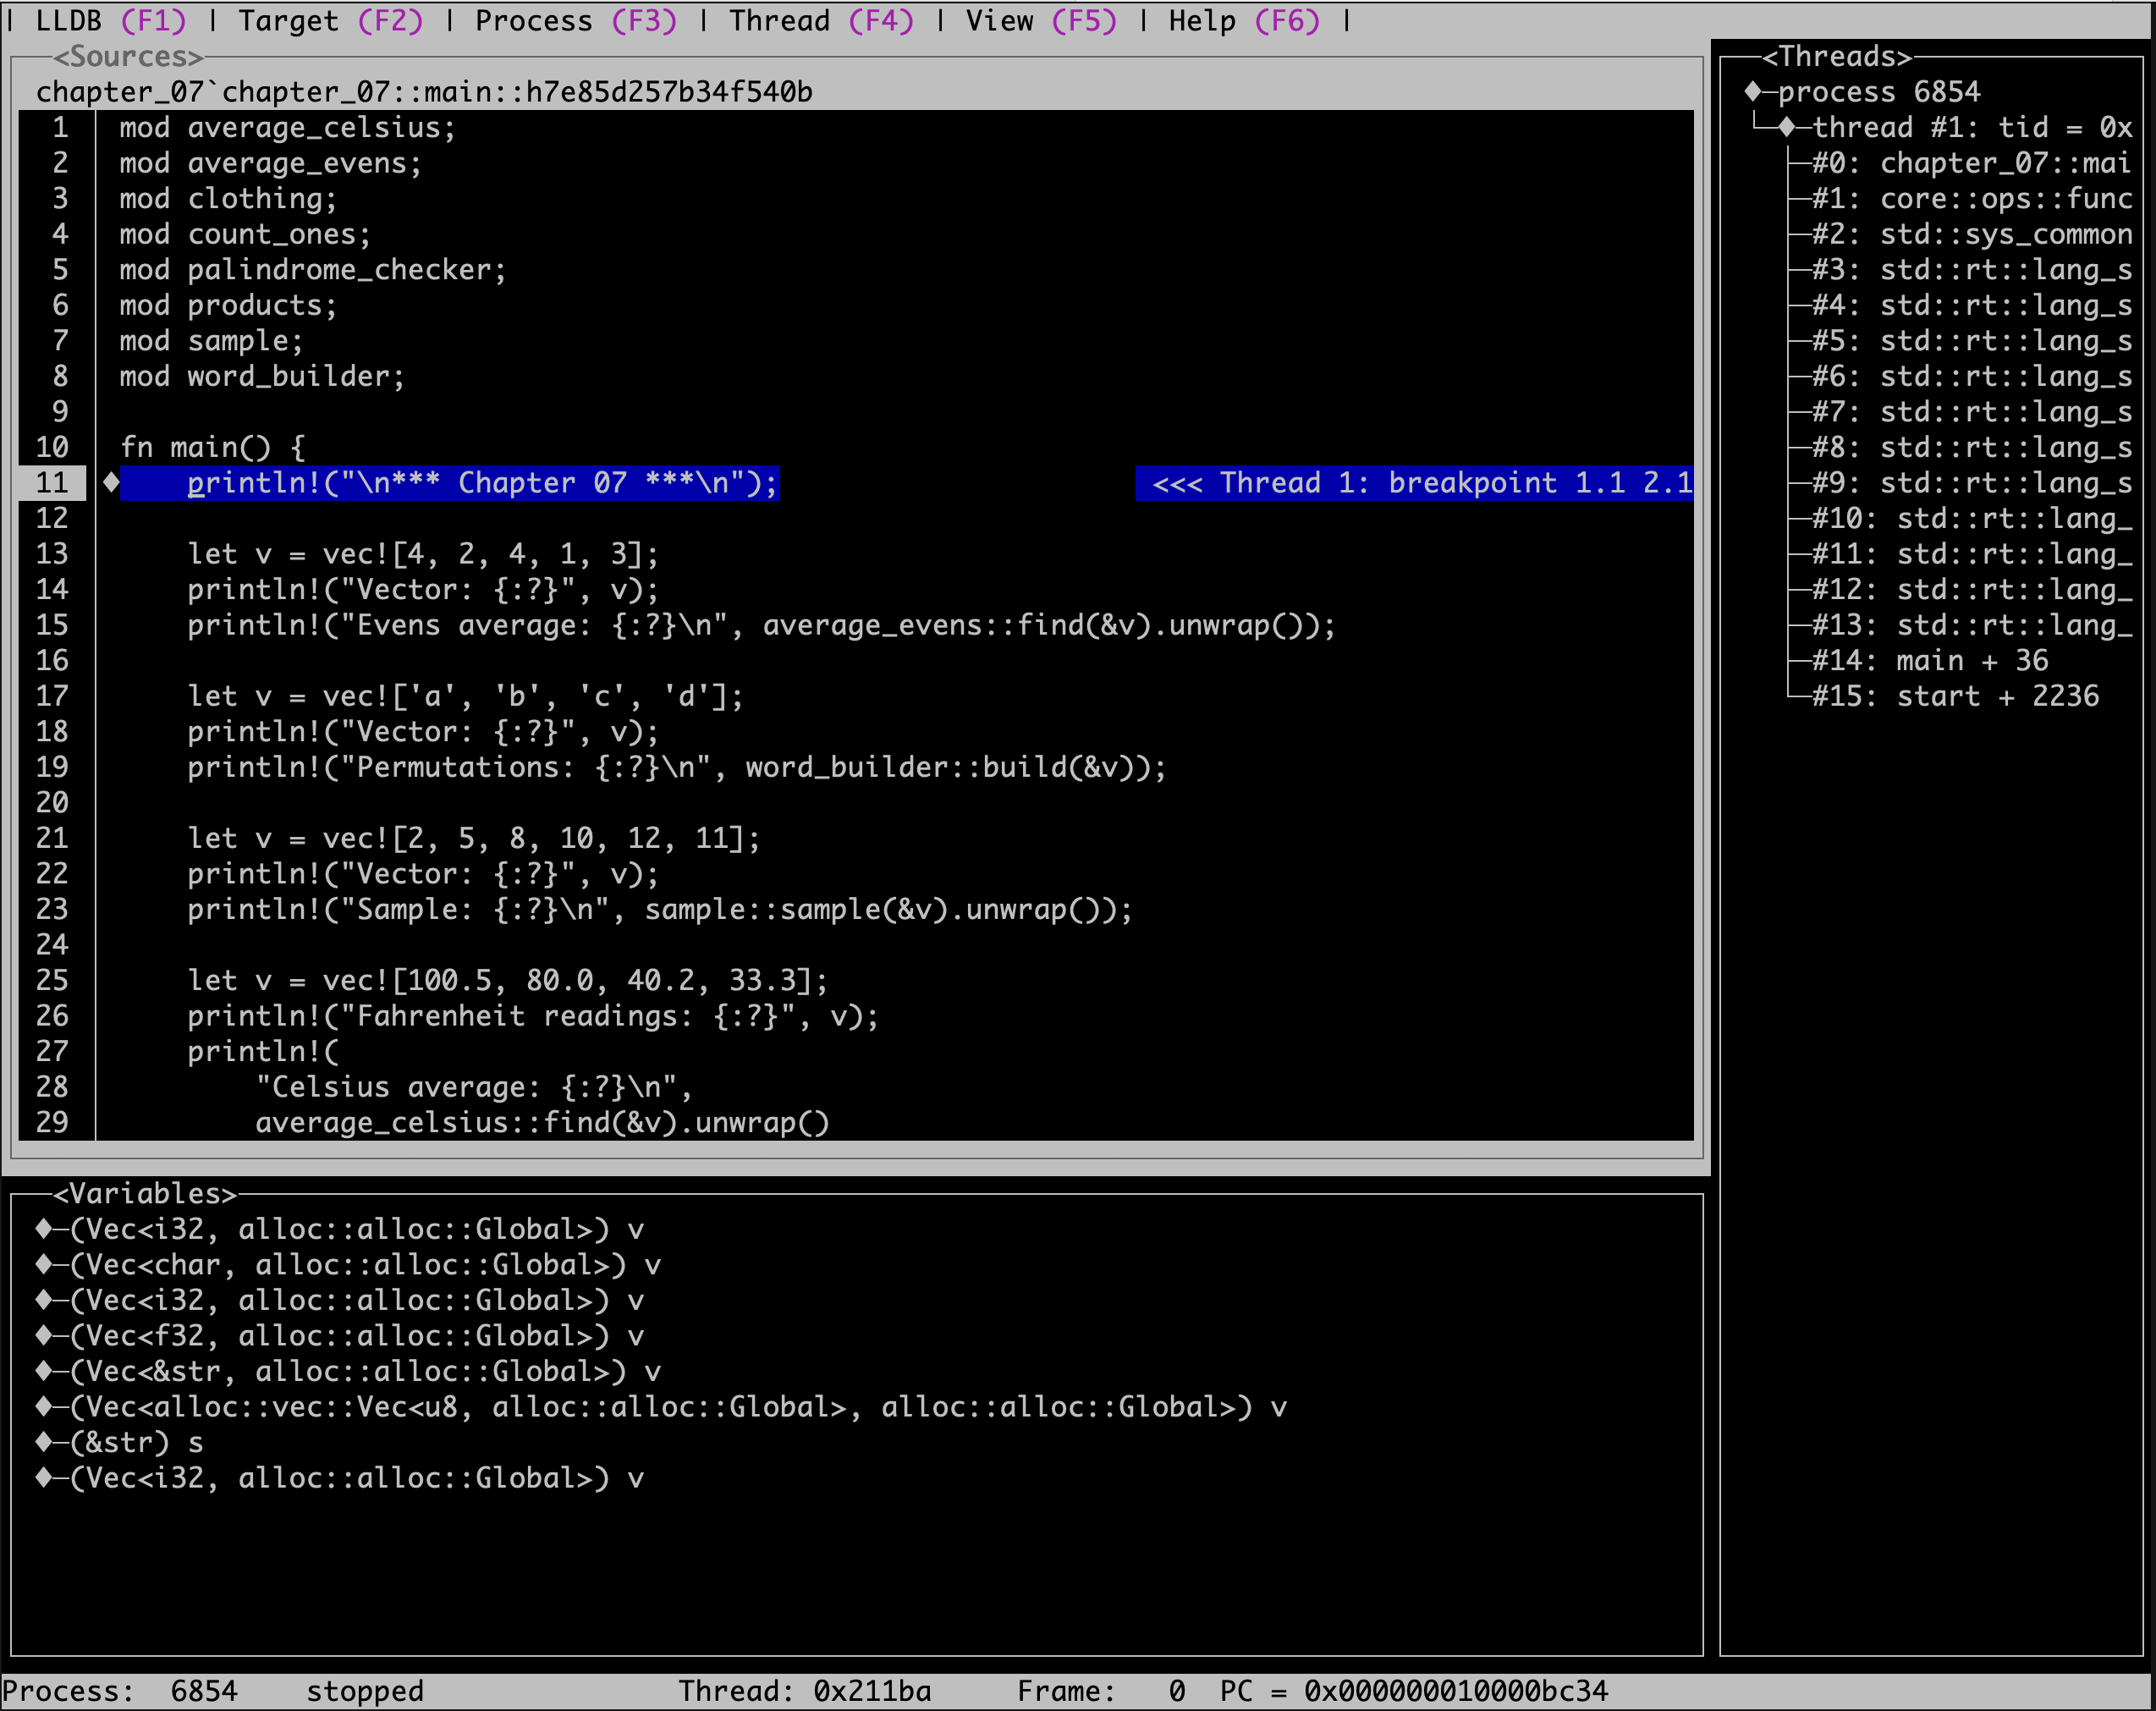
To finalize our introduction to LLDB, note that the command gui switches to visualizing a running process in the text user interface (TUI), which is probably the interface many IDE users could find more convenient to use. While in this mode, press h to see the commands cheat sheet; exit back to the common interface by hitting ESC (or F1).
For more details on how to use LLDB consult its documentation or – even better as of today – the Apple archived LLDB Debugging Guide.
Correspondingly, using other debugging tools, look up their documentation: GDB documentation, Get started with Windows debugging.
[I'm inadvertently getting to the #RTFM phase 🙄]
